FIM Database for Multi-Model Visualization and Comparison
Introduction
FIM (Flood Inundation Mapping) Database is a framework designed to store compiled flood maps from multiple hydraulic models including reference flood maps. The structure and workflow of the FIM Database for Multi-Model Flood Map Retrieval and Visualization is shown in Figure 1.
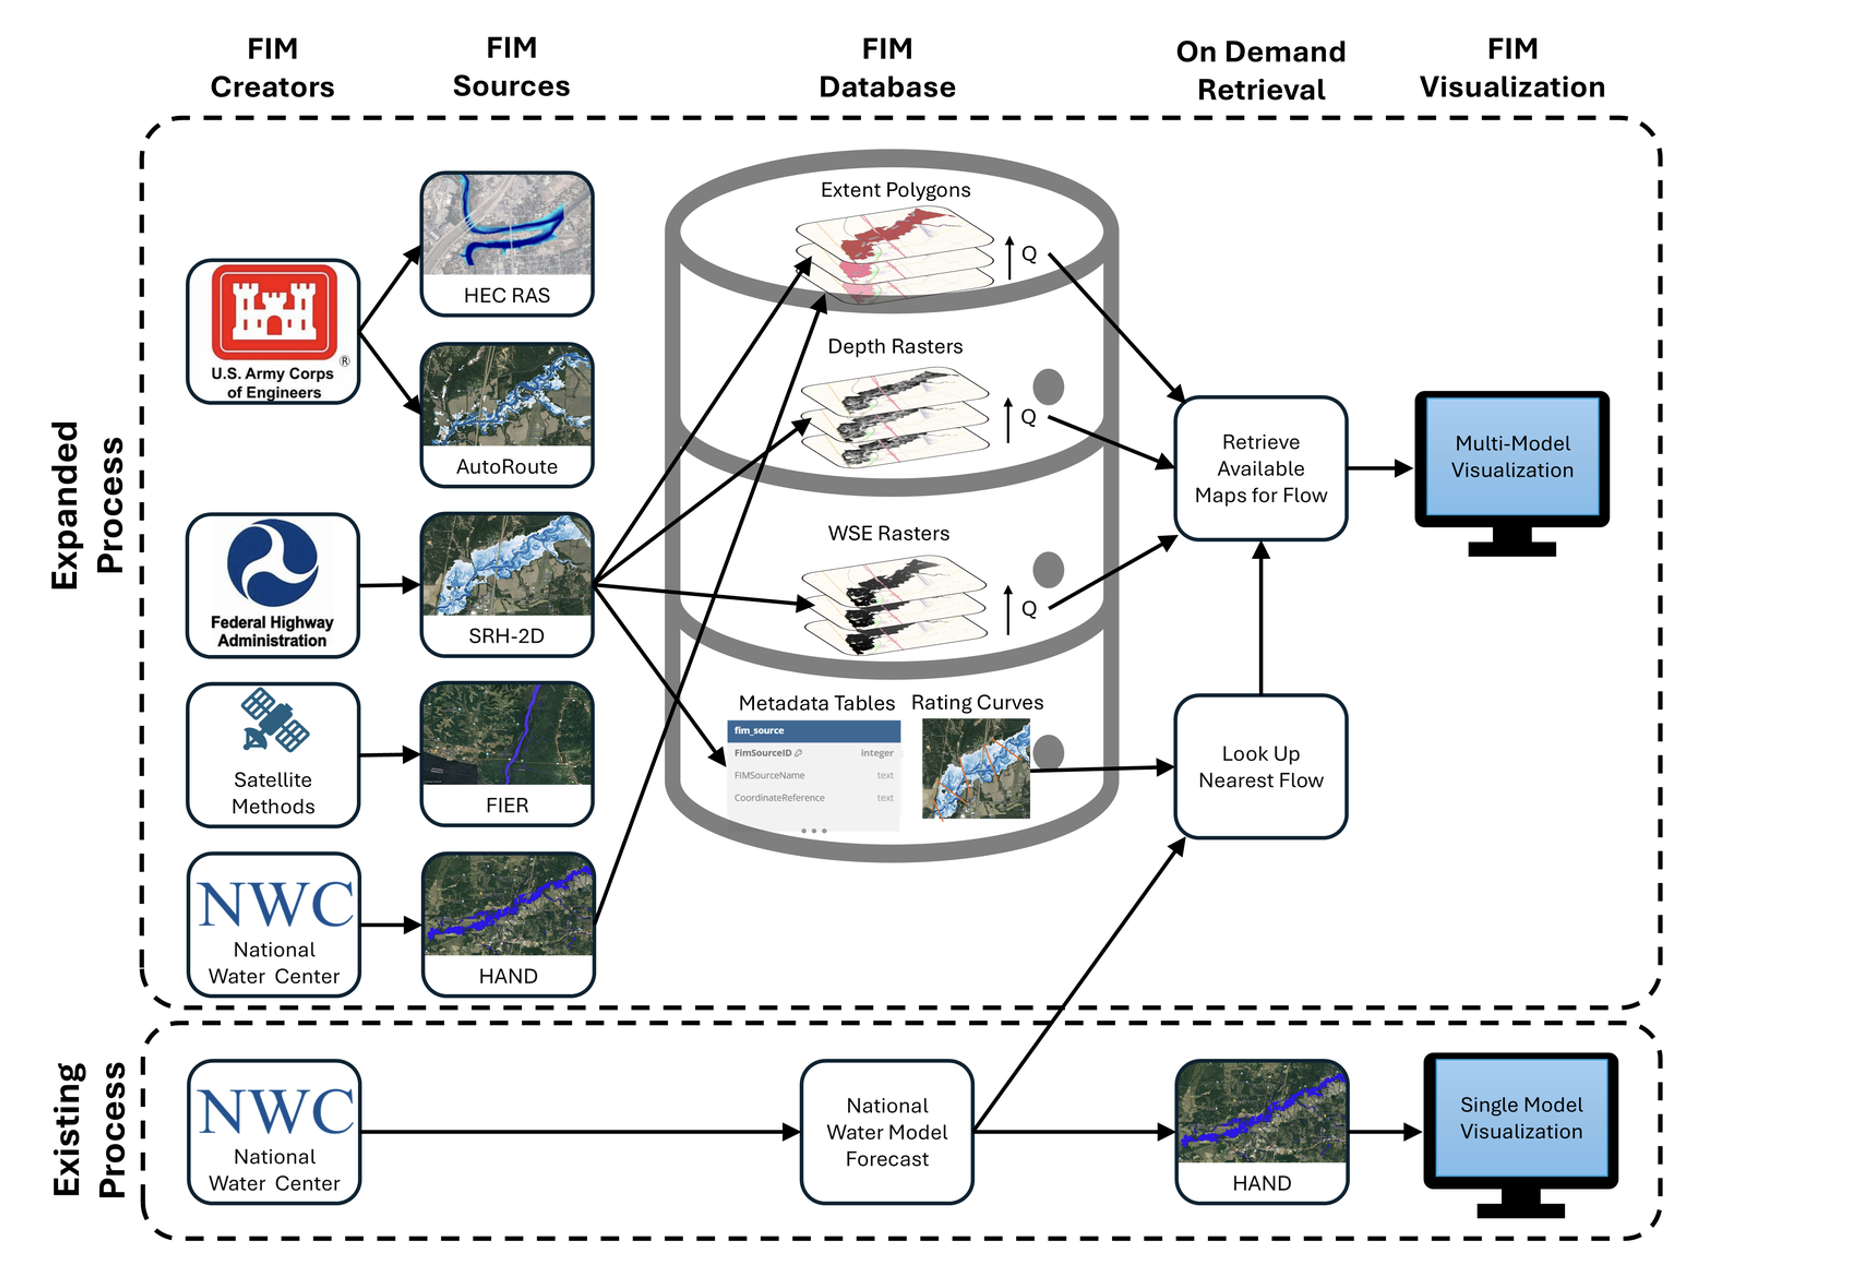
Figure 1: Overall framework of the database
This documentation is intended to guide the water resources community to create a FIM (Flood Inundation Mapping) Database using flood maps generated from multiple hydraulic models. Users can upload and visualize custom flood maps, visualize flood extent scenarios for different flows, and compare flood extents by creating the database, storing it in hydroshare, and finally using the existing web application for the visualization. The application is available in the apps list in CIROH portal apps with the name "FIM (Flood Information Map Visualization Deck)" as shown in Figure 2.
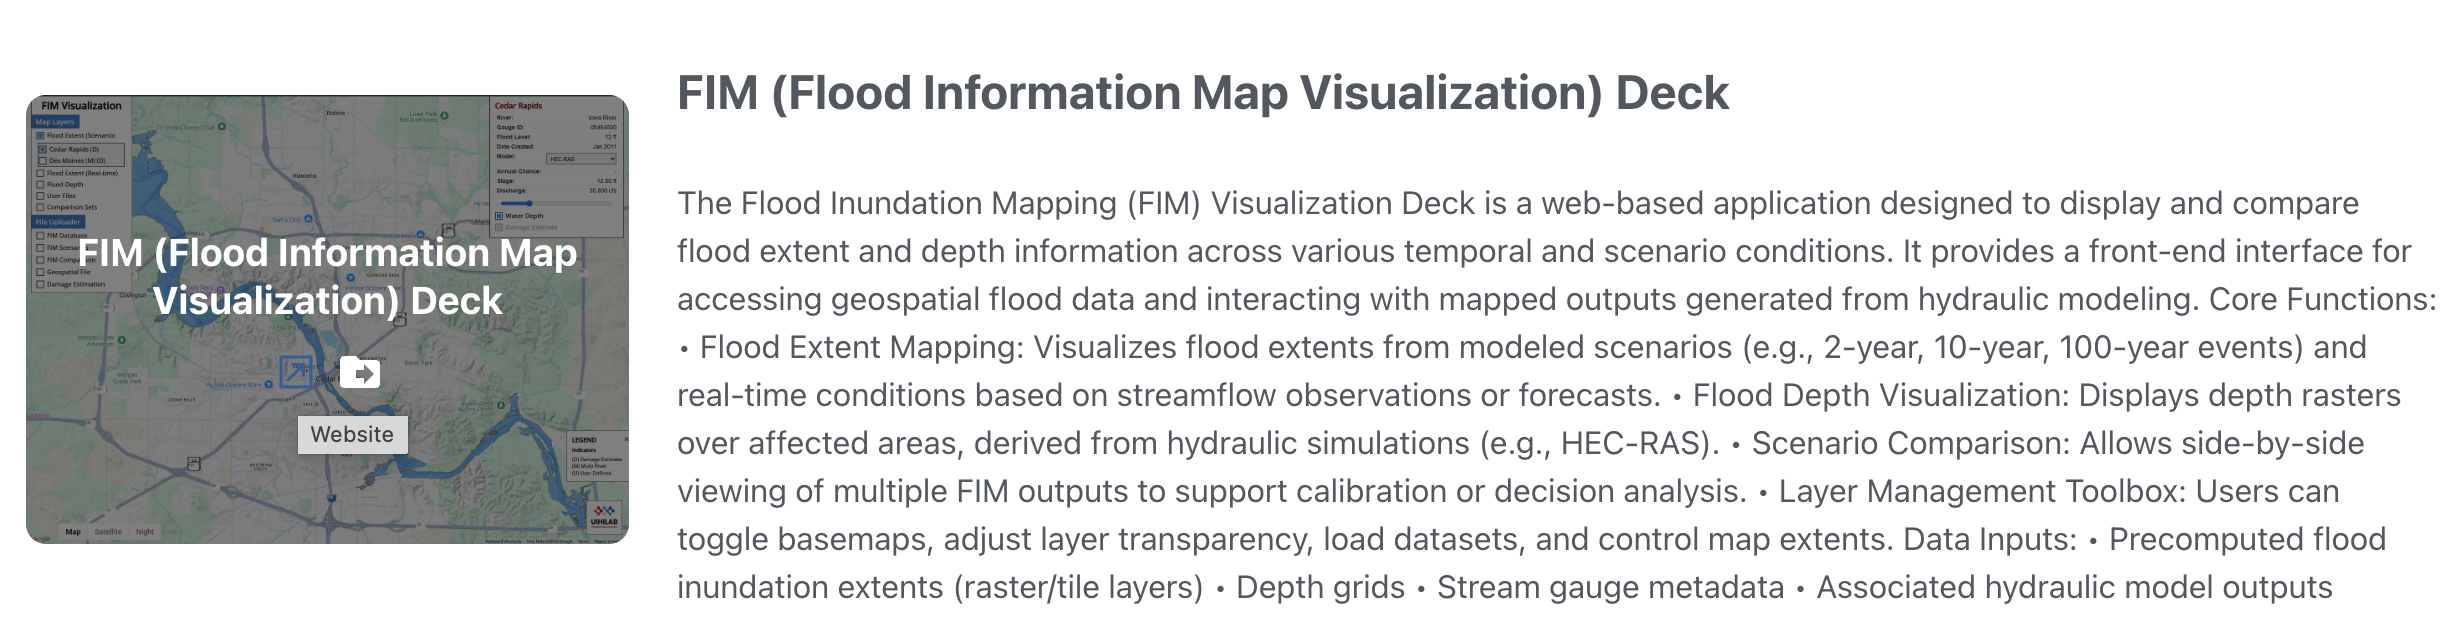
Figure 2: FIM Visualization Application
To access this application, click the arrow symbol located in the middle of the map image. You will then be navigated to the visualization application as shown in Figure 3.
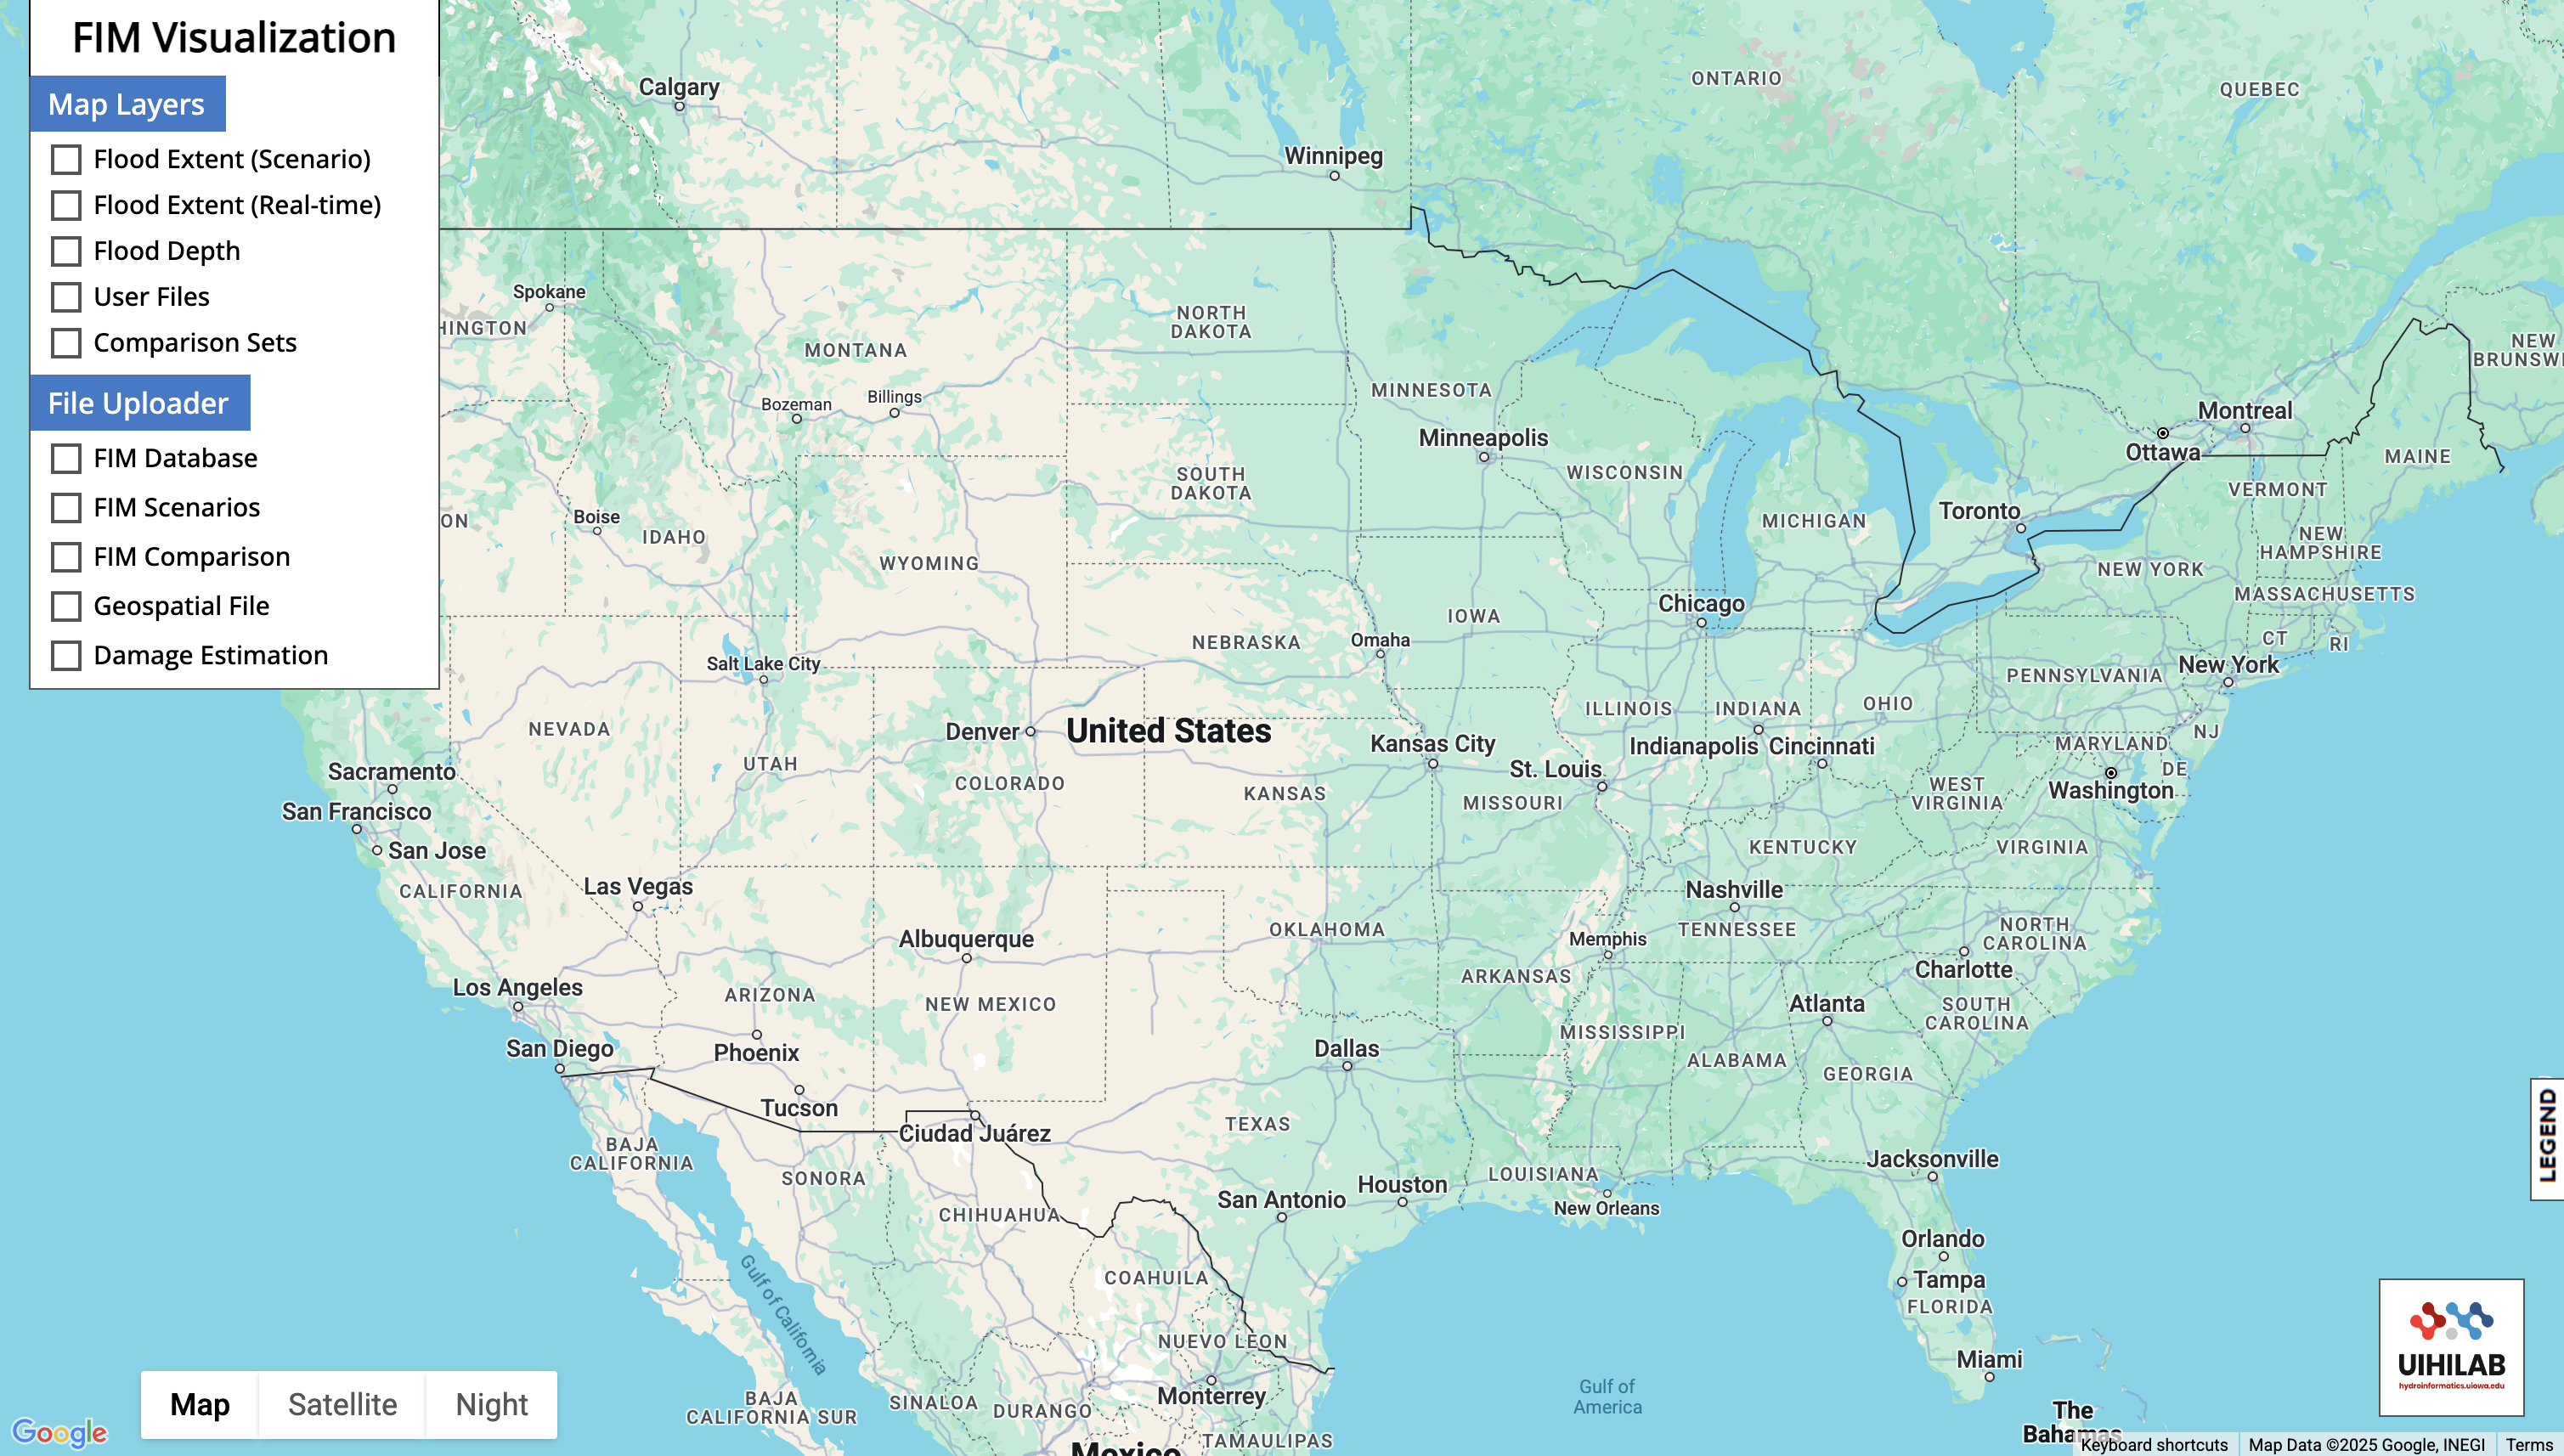
Figure 3: FIM Visualization Application
Creating a FIM database
It is assumed that users already have at least one hydraulic model from which flood maps can be generated for any area of interest. We guide users to be able to compare the flood map from that model with the baseline flood map for the same area from NWM HAND using FIMServ tool developed by our CIROH partners in University of Alabama. The flowchart for the overall methodology for creating the database and using it for visualization is shown in Figure 4 and explained in detail in subsequent section.
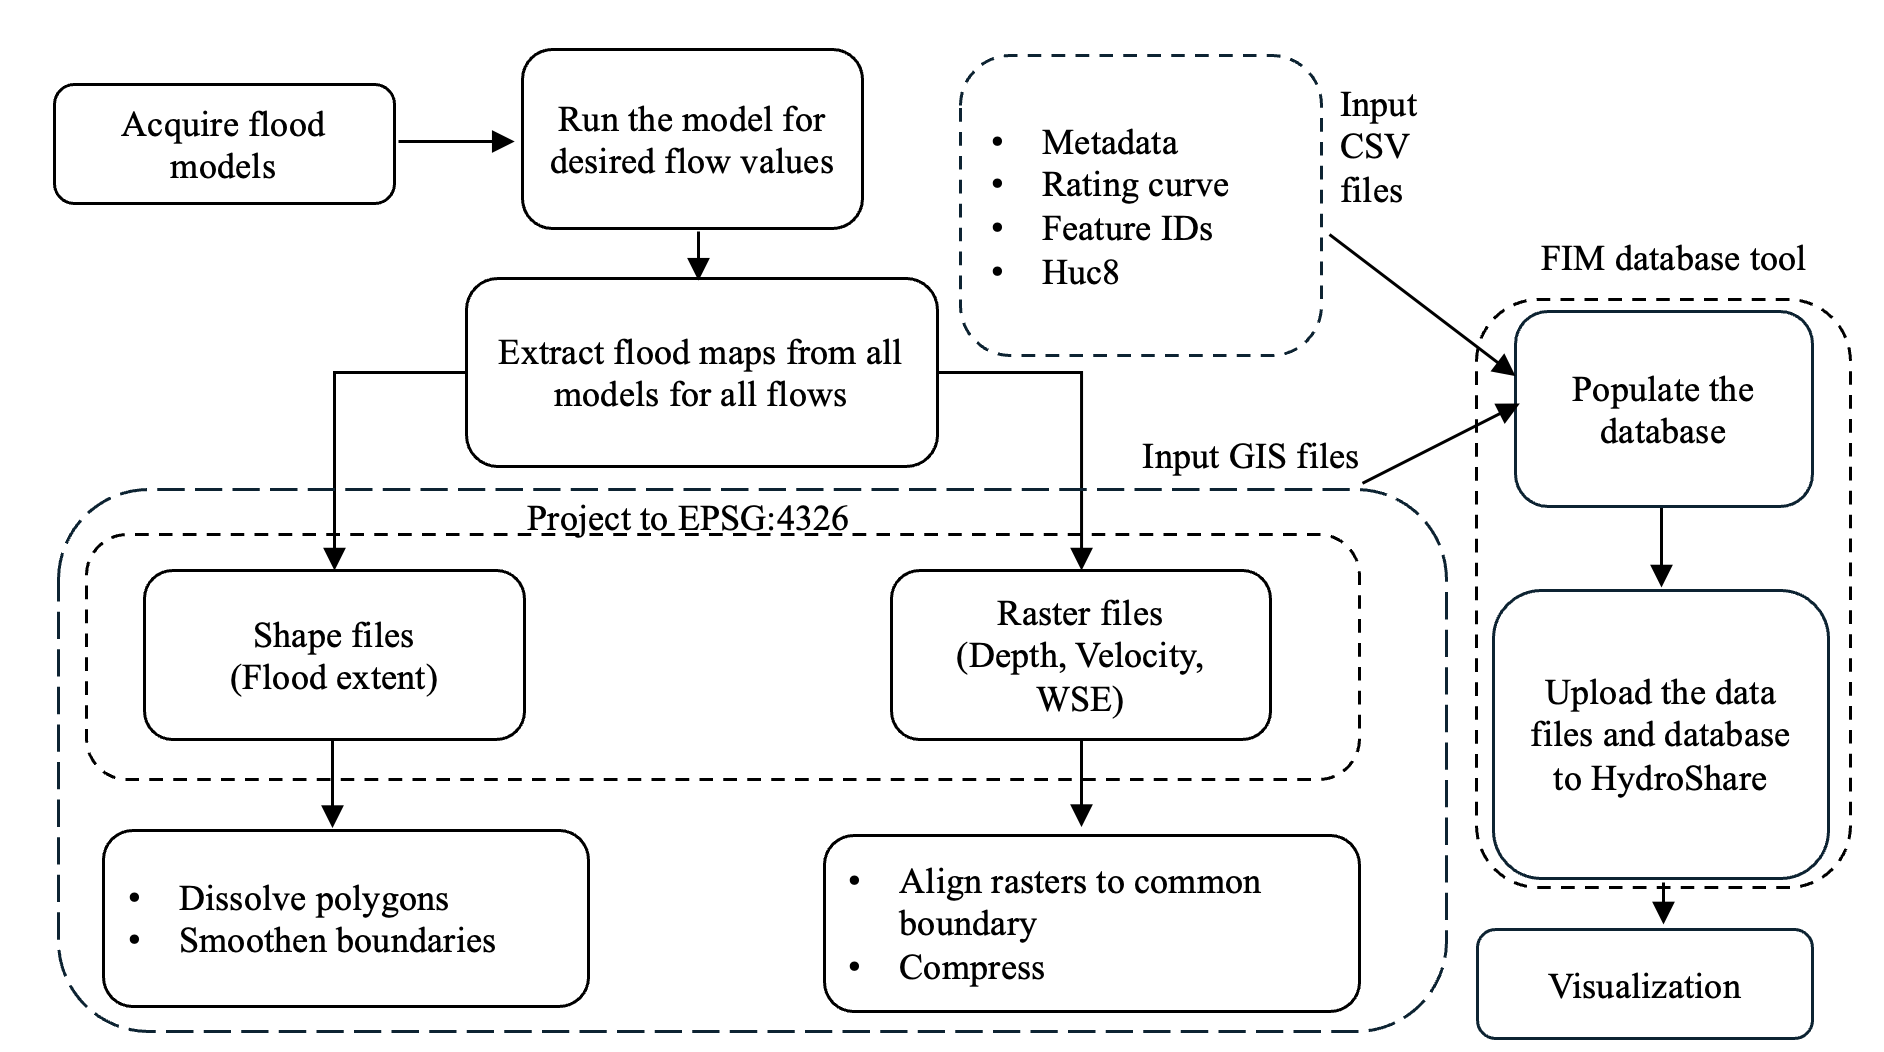
Figure 4: Methodology
Step 1:
Re-run your flood model with as many flow values as you desire. A basic database model may include flood maps for flow values corresponding to return periods ranging from 2 years to 1000 years. If you are using the NWM flows, you can find the return period values using the NWM_returnperiod_finder_Tool tool developed at Hydroinformatics Lab, BYU. You will need to have NWM feature IDs for the streams in your domain. You can use NWM_FeatureID_finder_Tool to find the feature IDs for your domain. This code gives you the IDs along the mainstream path only.
Step 2:
Run the HAND (Height Above Nearest Drainage) model for your area of interest. Follow the following steps to generate flood maps using HAND method.
- Generate the shape file of the model boundary from the model you have for your area of interest.
- Use the FimServe_Tool to create HAND-based flood maps by providing the same model boundary shapefile and the discharge values.
- This tool uses NWM (National Water Model) retrospective data by default to generate flood maps.
- To create flood maps for specific return periods, use return-period discharge values, instead of retrospective flow values, for each NWM reach ID using the tool mentioned in Step 1.
- Make sure the flood maps generated from your model and HAND model correspond to same discharge values if you want to make meaningful comparison.
- Clip the output maps with the model boundary shape file.
Step 3:
Extract all available flood maps generated from your hydraulic model and the HAND model. Flood maps may include:
- Shapefiles of flood extents
- Depth rasters
- Water surface elevation rasters
- Velocity rasters (if available)
Note: The HAND model generates only depth rasters, which can be converted to shapefiles using GIS tools.
Step 4:
- Reproject all raster and vector files to EPSG:4326 (WGS 84).
- Ensure that the spatial extents of all files match, which is necessary for comparison in the FIM Visualization Application.
- You can use GIS software or python codes for reprojection and alignment.
Step 5:
Prepare input files for populating the database. Here is the list of input files that you need for creating and populating ONE database (corresponding to your area of interest).
Table 1 Required input files for creating FIM database.
| S.N. | Generic File Name | Quantity | Description |
|---|---|---|---|
| 1. | FIM_input_data.csv | 1 | Insert details of the models that are to be used in FIM database |
| 2. | Huc8.csv | 1 | Assuming that the extent for all models is the same |
| 3. | {River}_{model}_flows.csv | 1 for each model type | Contains rating curve information for each model. Enter the file names of the raster and vector files that were generated in step 4. |
| 4. | Feature_ids_{model}.csv | 1 for each model type | Contains the list of NWM feature IDs for the area and their Lat, Long values |
You can use these sample input files for your reference. Remember all the column headers should be exactly as they appear in these sample files.
Also, the name of the models in “software” column in FIM_input_data.csv file should match with the ones as shown in Table 2.
Table 2 The list of software names currently included in the database.
| ModelTypeID | Software |
|---|---|
| 0 | HEC-RAS 1D |
| 1 | HEC-RAS 2D |
| 2 | HEC-RAS 1D/2D Combo |
| 3 | SRH-2D |
| 4 | FIER |
| 5 | AutoRoute |
| 6 | HAND |
| 7 | TRITON |
| 8 | Satellite Observations |
| 9 | Surveyed Flood Extents |
| 10 | Others |
To get the HUC8 number for the area, use the latter part of NWM_FeatureID_finder_Tool.
Step 6:
Use the FIM_database_tool for step-by-step instructions to create and upload the FIM database to your HydroShare account.
- Upload all input files (from Step 5) and GIS files (from Step 4) to the content section of Google Collab notebook.
- Run each code cell carefully following the notebook instructions.
Database storage
After completing the code execution from Step 6:
- All GIS files will be uploaded to your HydroShare account.
- Two JSON files will be generated:
{filename}.jsonis used for custom file visualization{filename}_vis.jsonis used for scenario visualization
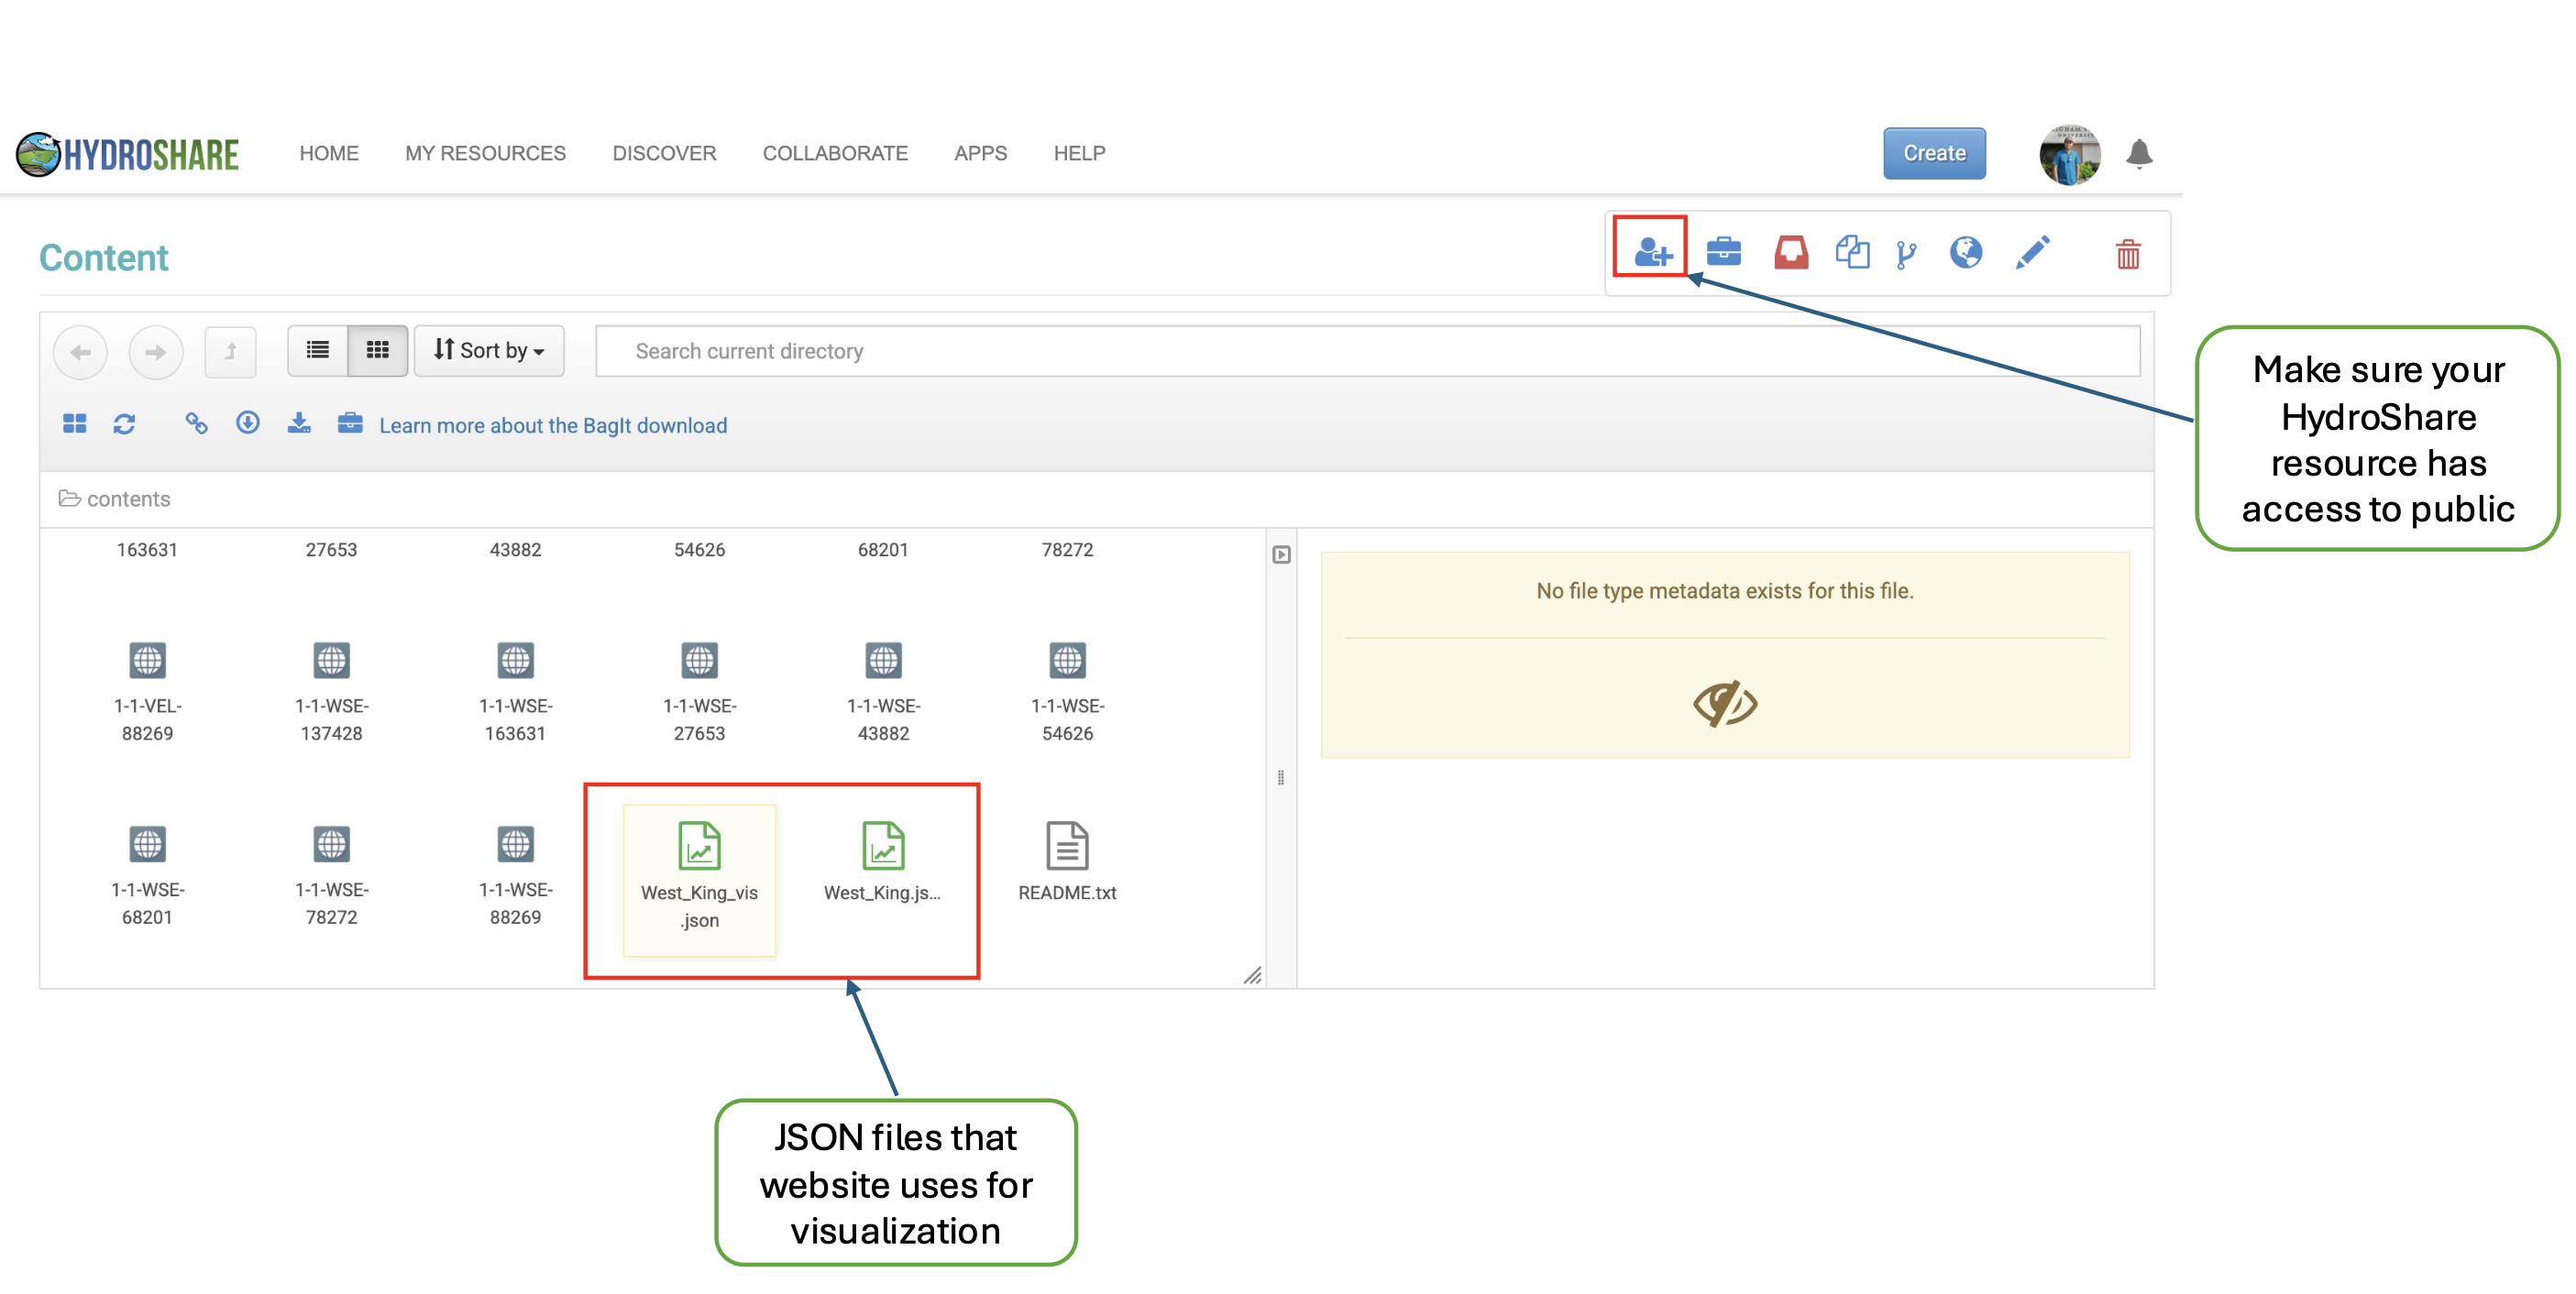
Figure 5: HydroShare resource with GIS files and two JSON files used for visualization
Visualization of database
Custom files visualization
To view the individual flood maps, paste the URL of the {databasename}.json file in the FIM database uploader section of FIM Visualization Application. This will give you the list of all the flood map files available in your database. You can select the desired files that you want to visualize. The selected files will appear in the "User Files" section in the map layers of the visualization application. You can toggle between each individual files as shown in Figure 5.
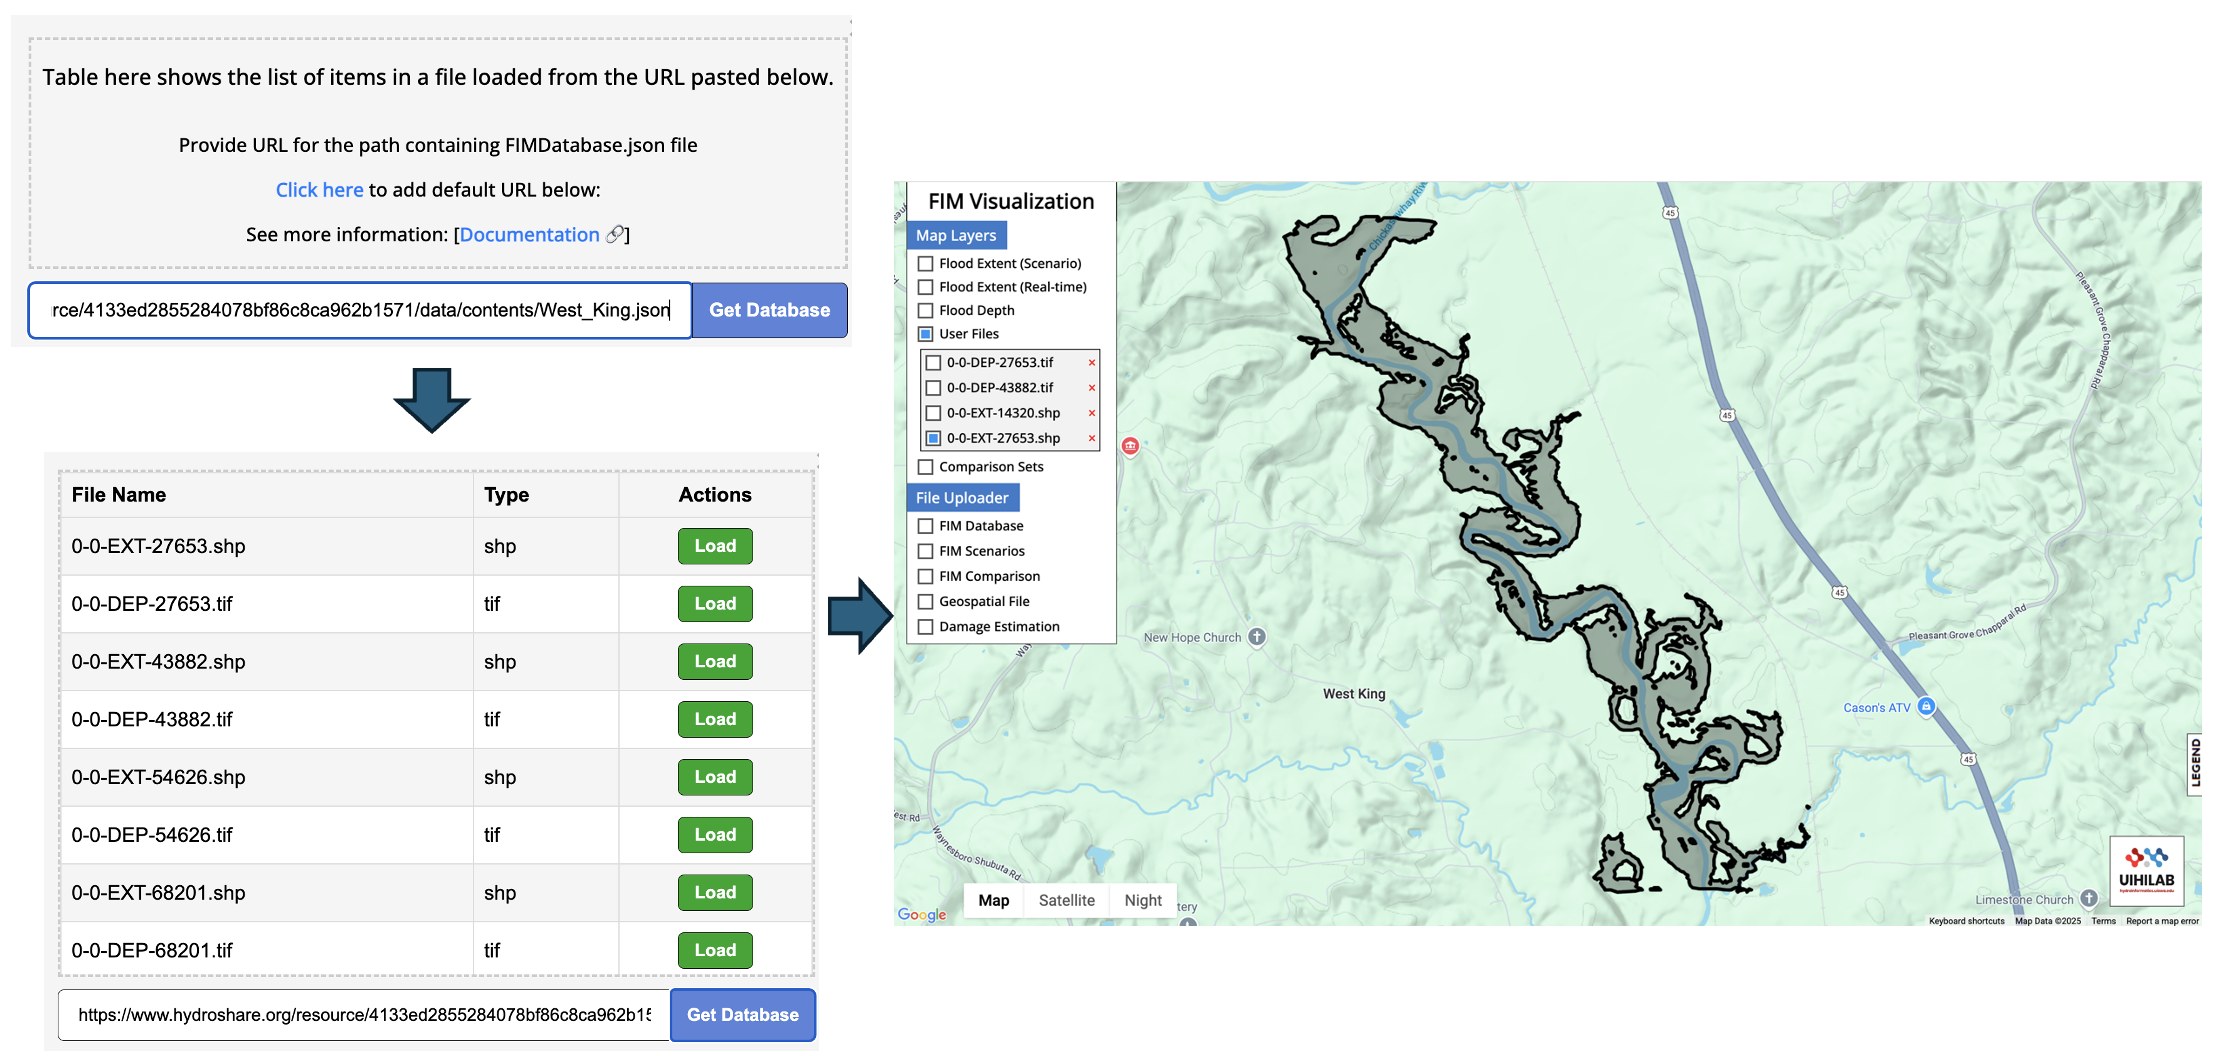
Figure 6: Custom files visualization in FIM visualization Application
Scenario visualization
To view the scenarios, paste the URL of the {databasename}_vis.json file in the FIM Scenarios uploader section of the Visualization application. You can select the model type from the dropdown available in the top right panel. For a model, you can move the slider button and change the flow values to visualize the corresponding flood map as shown in Figure 7.
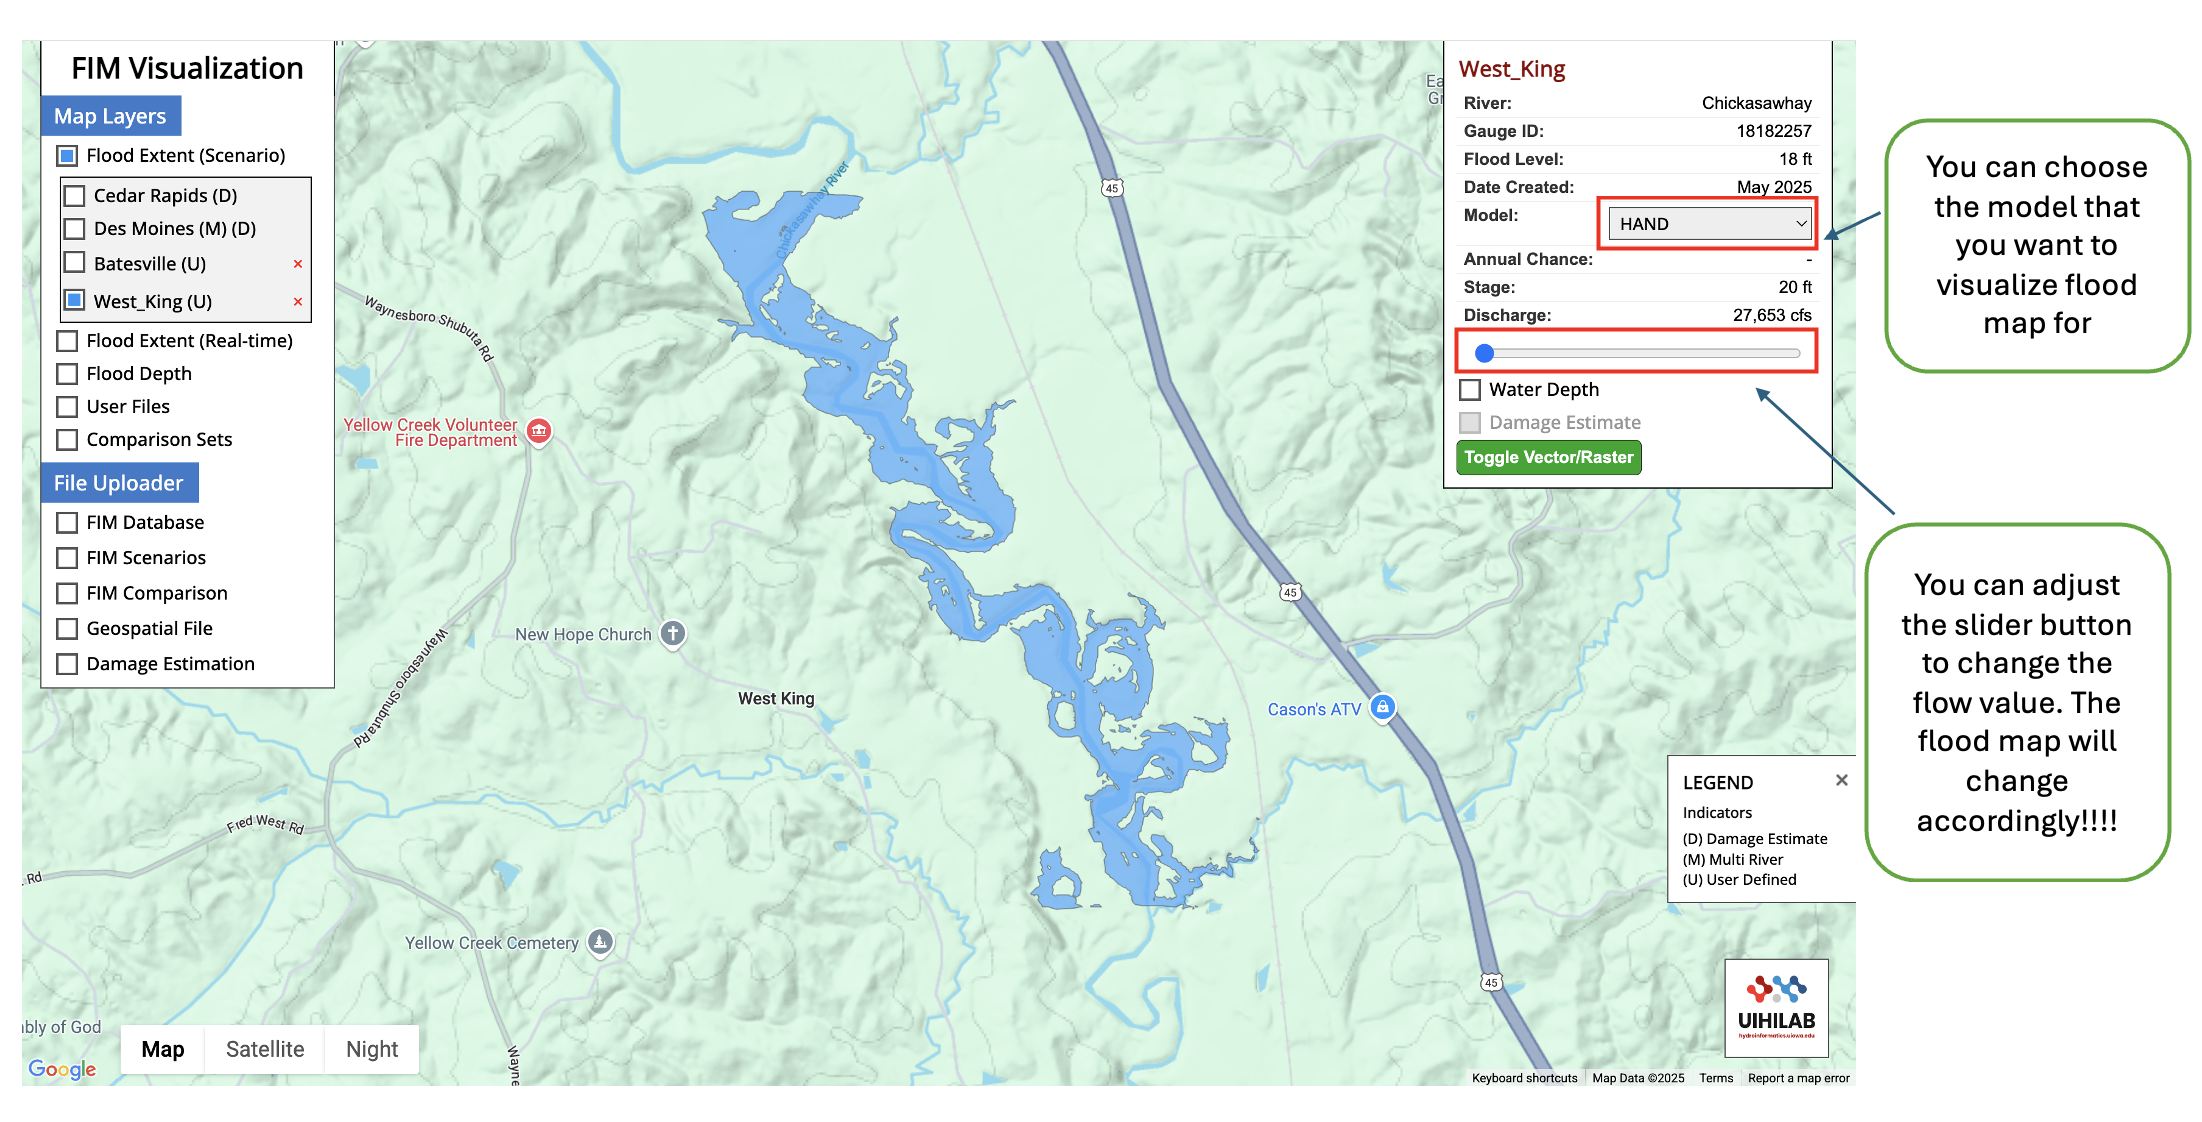
Figure 7: Scenario visualization in FIM visualization Application
Comparison of flood maps
Any two flood maps from any two models across any scenarios can be compared. To do this, select the FIM comparison option in the Data Uploader section and choose "Existing Scenarios". Select the name of database, names of model, and the scenarios that you want to compare. This will allow comparative visualization of those scenarios along with displaying the comparison metrics as shown in Figure 8. Similar comparison can also be performed by uploading any two flood map raster files (with same raster boundary) externally from your machine by selecting "User file upload" instead of "Existing Scenarios".
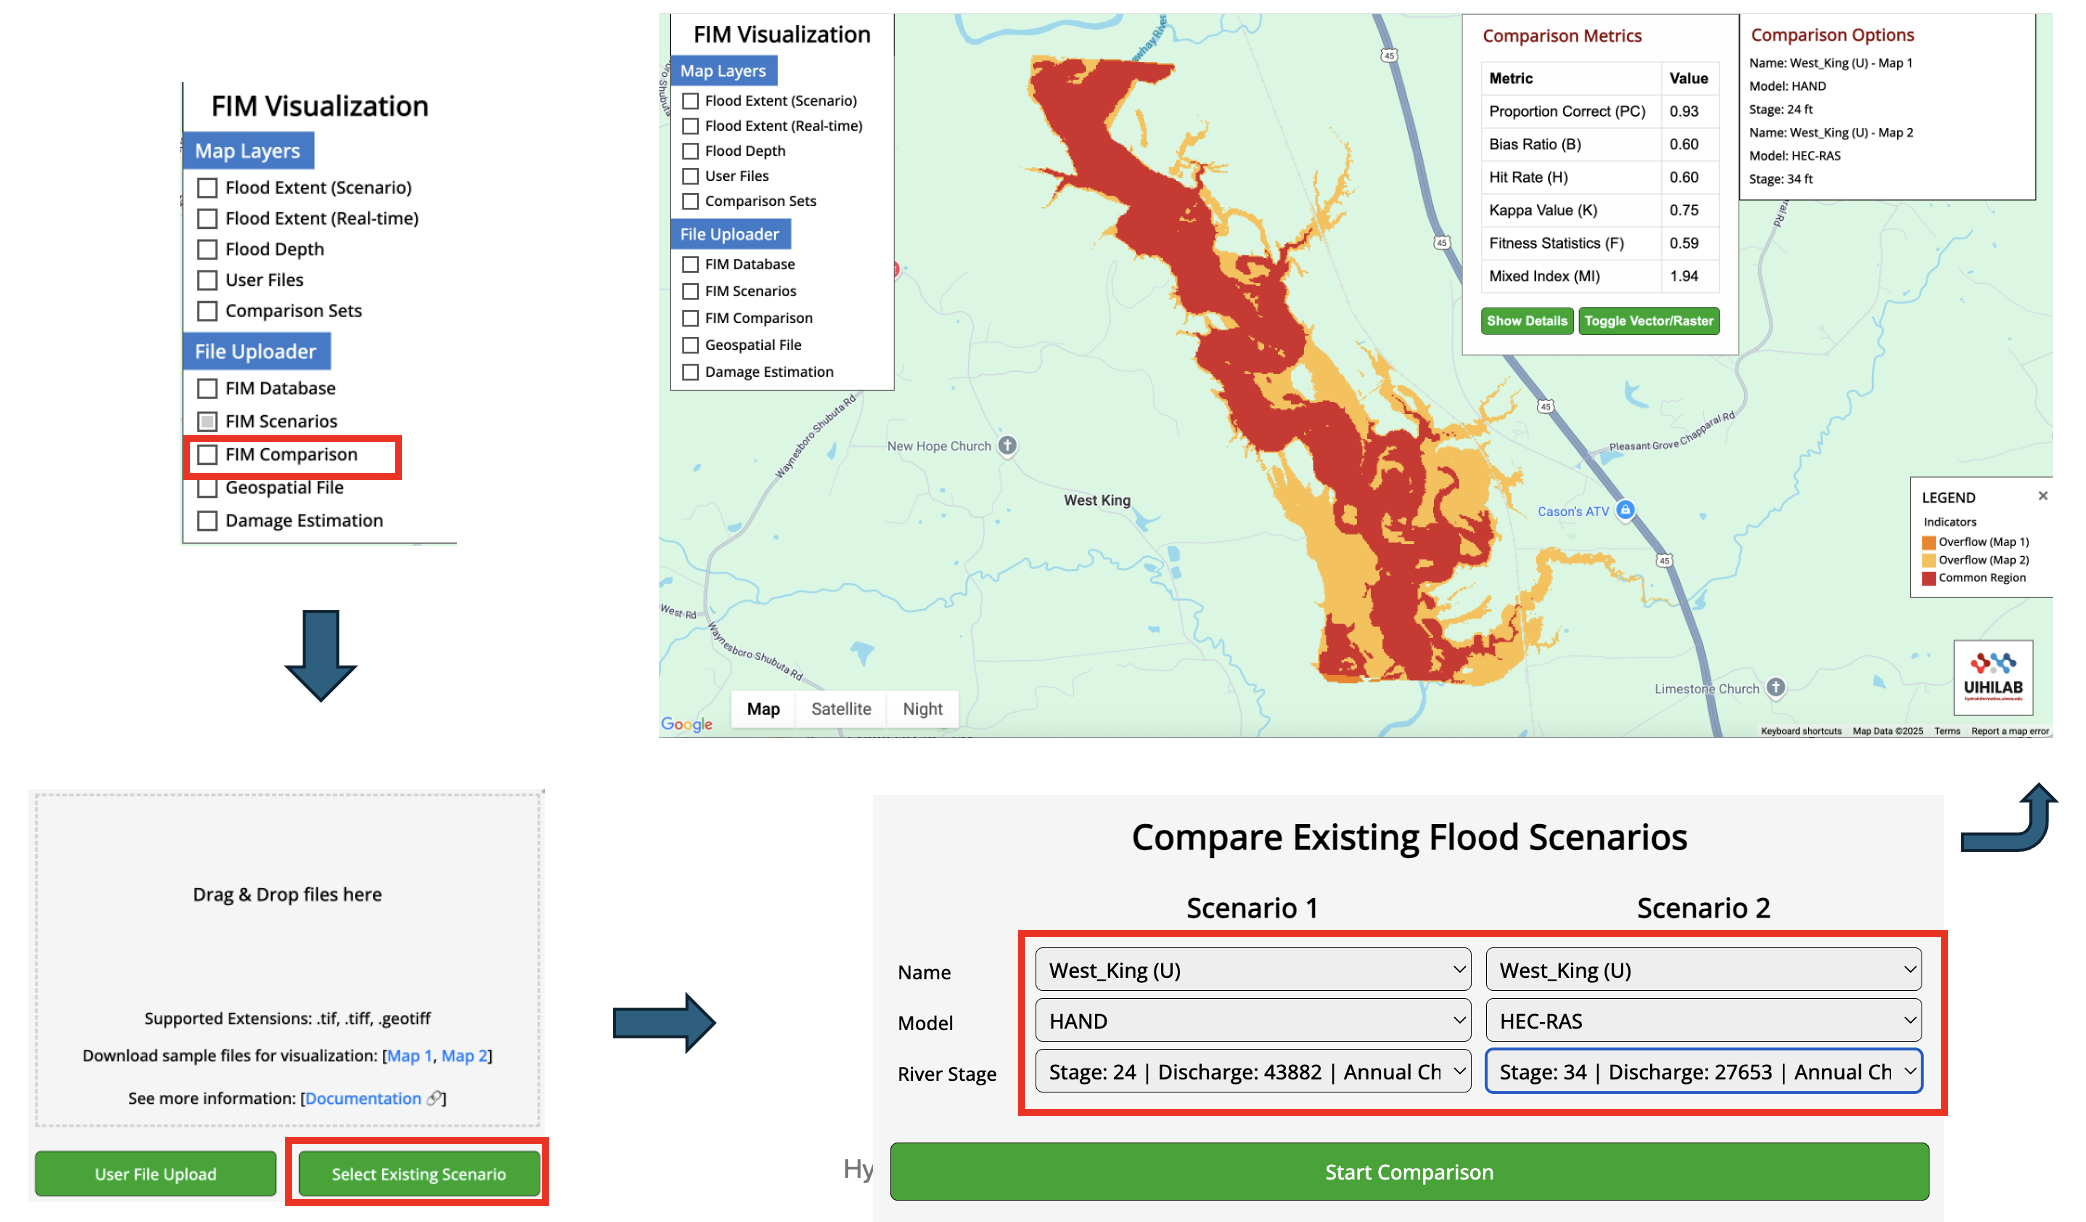
Figure 8: Comparison of two flood maps indicating different inundation extents and displaying comparison metrics for the two inundation maps, including proportion correction, bias ratio, hit rate, kappa value, fitness statistics, and mixed index
Funding Acknowledgement
This research was supported by the Cooperative Institute for Research to Operations in Hydrology (CIROH) with funding under award NA22NWS4320003 from the NOAA Cooperative Institute Program.
Contact information
If you have any queries, please contact:
Pitamber Wagle
Ph.D. Student, Brigham Young University
Email : waglep@byu.edu